IL Farm Bureau Drought Stats
This comes from Blake Roderick, the Executive Director of the Pike County, IL Farm Bureau.
We thought this might be of interest to you all as you develop stories on the drought.
Today, the Pike County Farm Bureau sent a message encouraging the USDA-FSA to expedite efforts to declare Pike County, Illinois as a disaster county.
Such a declaration will make low interest loans available to farmers affected by the drought.
It will also open the possibility of haying and grazing of land currently enrolled in USDA’s Conservation Reserve Program.
Summary of IL Drought Statistics
Compiled by Illinois Farm Bureau
Created July 10, 2012; updated July 13
| Illinois rainfall totals measured in inches | 1987 | 1988 | 2012 |
| February | 1.96 | 2.12 | 1.18 |
| March | 2.05 | 3.26 | 2.09 |
| April | 2.51 | 1.85 | 3.15 |
| May | 2.58 | 1.76 | 2.57 |
| June | 3.29 | 1.05 | 1.87 |
Source: National Oceanic and Atmospheric Administration National Climatic Data Center
Precipitation
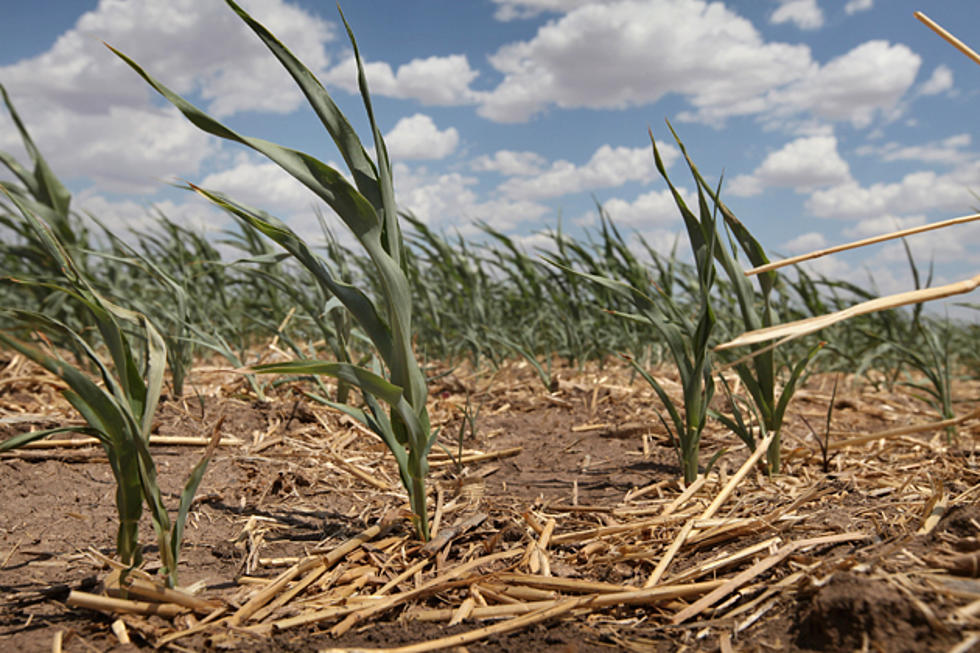
Illinois is falling deeper into drought conditions, as agricultural impacts are now becoming much more evident and hydrologic conditions continue to deteriorate. There is very little precipitation in the forecast at a time when substantial rains are needed to avoid agricultural damages. Although drought conditions are greatest in southern Illinois and parts of central Illinois, the area of concern is also spreading to northern Illinois.
The statewide average precipitation for June was 1.8 inches, which is 2.3 inches below normal and 43 percent of normal. It was the eighth driest June on record. June 1988 was the driest on record at 1.1 inches.
The statewide average precipitation for the first half of 2012 was 12.6 inches, making it the sixth driest on record. The first half of 1988 was slightly worse at 12.0 inches.
Statewide precipitation deficits since January 1, 2012 have grown to 4 to 6 inches across northern Illinois, 6 to 10 inches across central Illinois and 10 to 12 inches or more in southern Illinois.
Agricultural Conditions
According to the July 9 Illinois Weather and Crops Report, only 19% of the corn crop and 20% of soybeans are rated good to excellent. Just two weeks earlier, 37% of corn and 35% of soybeans were rated good to excellent. Virtually all soils in the state – 96% – are considered to have short or very short moisture levels.
Source: Illinois State Water Survey (ISWS) Drought Update July 9, 2012
Comparison of Illinois corn and soybean crop conditions: 1988 vs. 2012 Source: Illinois Agricultural Statistics Service (Report dates 7/5/88; 7/9/12) | ||||||
| Excellent | Good | Fair | Poor | Very Poor | ||
| 1988 | Corn | 0% | 18% | 60% | 20% | 2% |
| 2012 | 2% | 17% | 33% | 25% | 23% | |
| 1988 | Soybeans | 0% | 15% | 69% | 14% | 2% |
| 2012 | 2% | 18% | 38% | 25% | 17% | |
More From KHMO-AM 1070, News-Talk-Sports